Ground-based
From any observatory
- Any site: latitude, longitude, altitude, or a stations file
- Atmospheric extinction, refraction near the horizon, twilight and moonlight
- Daylight and elevation limits, observable windows of the coming hours
LightCurve renders satellites and rocket bodies on the GPU, integrates the sunlight they reflect toward your sensor — on the ground or in orbit — and turns it into apparent magnitude, signal-to-noise and light curves. Then it reads your measurements back — and explains them.
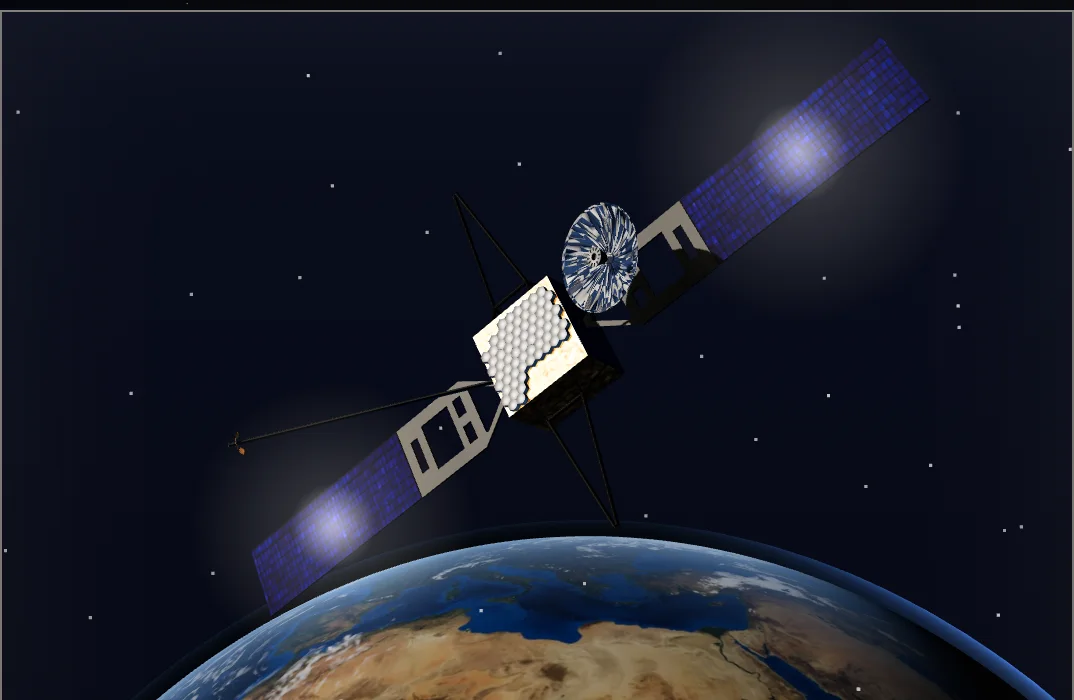
Most tools stop at a magnitude. LightCurve keeps the whole chain in one place — the object, the geometry, the light, the sensor and the measurement — so every number can be traced back to its cause.
Shape, materials and attitude: a reference model, a DISCOS shape or your CAD.
Date, orbit, observer on the ground or in orbit, sky and atmosphere.
A GPU render from the observer: per-pixel BRDF, self-shadowing, earthshine.
Apparent magnitude, extinction, sensor SNR, phase, 24-hour and spin curves.
Your measurements read back: period, attitude state, model fitted to the data.
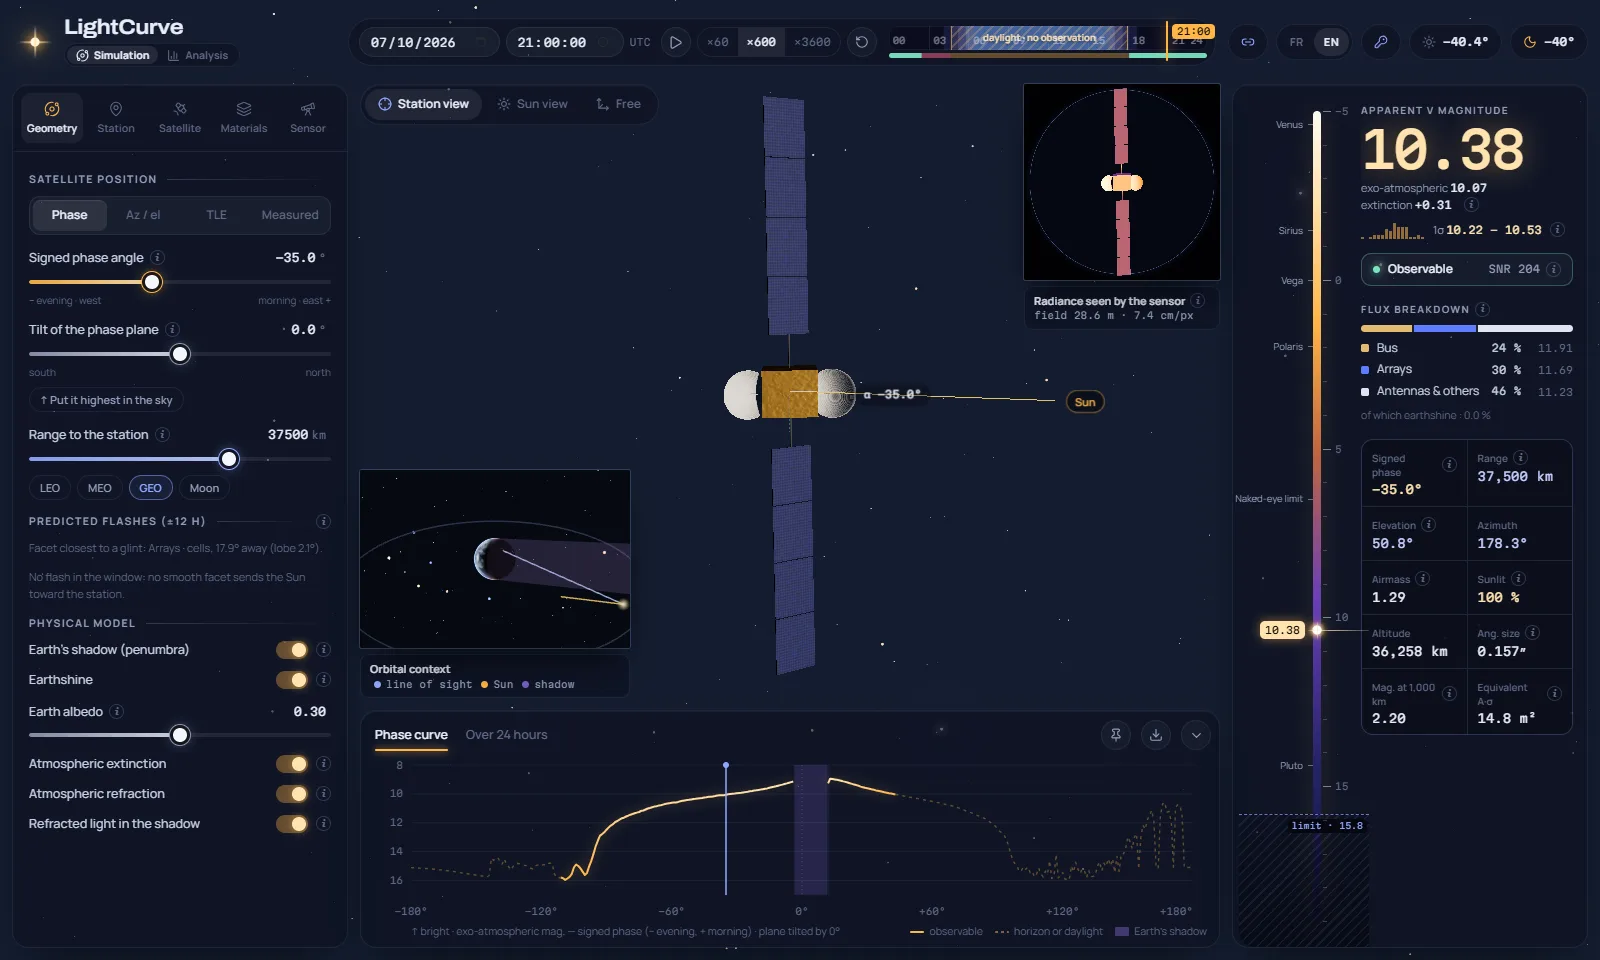
On a scale from Venus to Pluto, with the flux broken down by material and the limit of your sensor.
The radiance image of the object, the 3D scene lit by the Sun and the orbital context.
Phase, 24-hour and spin light curves recomputed in the background as you change anything.
Turn magnitudes into answers: is it stabilised, spinning or tumbling, how fast, how big — and does a physical model explain what your sensors measured?
See the use caseFrom design review to anomaly investigation: how bright your spacecraft looks, where its glints come from, and what a change in its light curve means.
See the use caseThe magnitude of every design option along real passes, with its uncertainty — to build satellites that astronomers can live with.
See the use caseEstimate a target’s spin period, its axis and how they evolve, from ground photometry — to plan the approach and the capture of a non-cooperative object.
See the use caseSNR, limiting magnitude and saturation of real telescope and camera combinations, against the objects you must see — from the ground or from orbit.
See the use caseMonths of tracks from many stations, turned into a report per object — behaviour, rotation trend, glints — and alerts the day something changes.
See the use casePhysically rendered, perfectly labelled synthetic light curves — shape, attitude state, period, axis, geometry, sensor noise — by the thousand.
See the use caseSee why a satellite brightens or fades — phase angle, glint, shadow, attitude — live and in 3D, with physics you can check.
See the use caseThe same physics for a telescope on a mountain and for a camera on a satellite: pick the vantage point, LightCurve changes the geometry, the sky and the constraints that go with it.
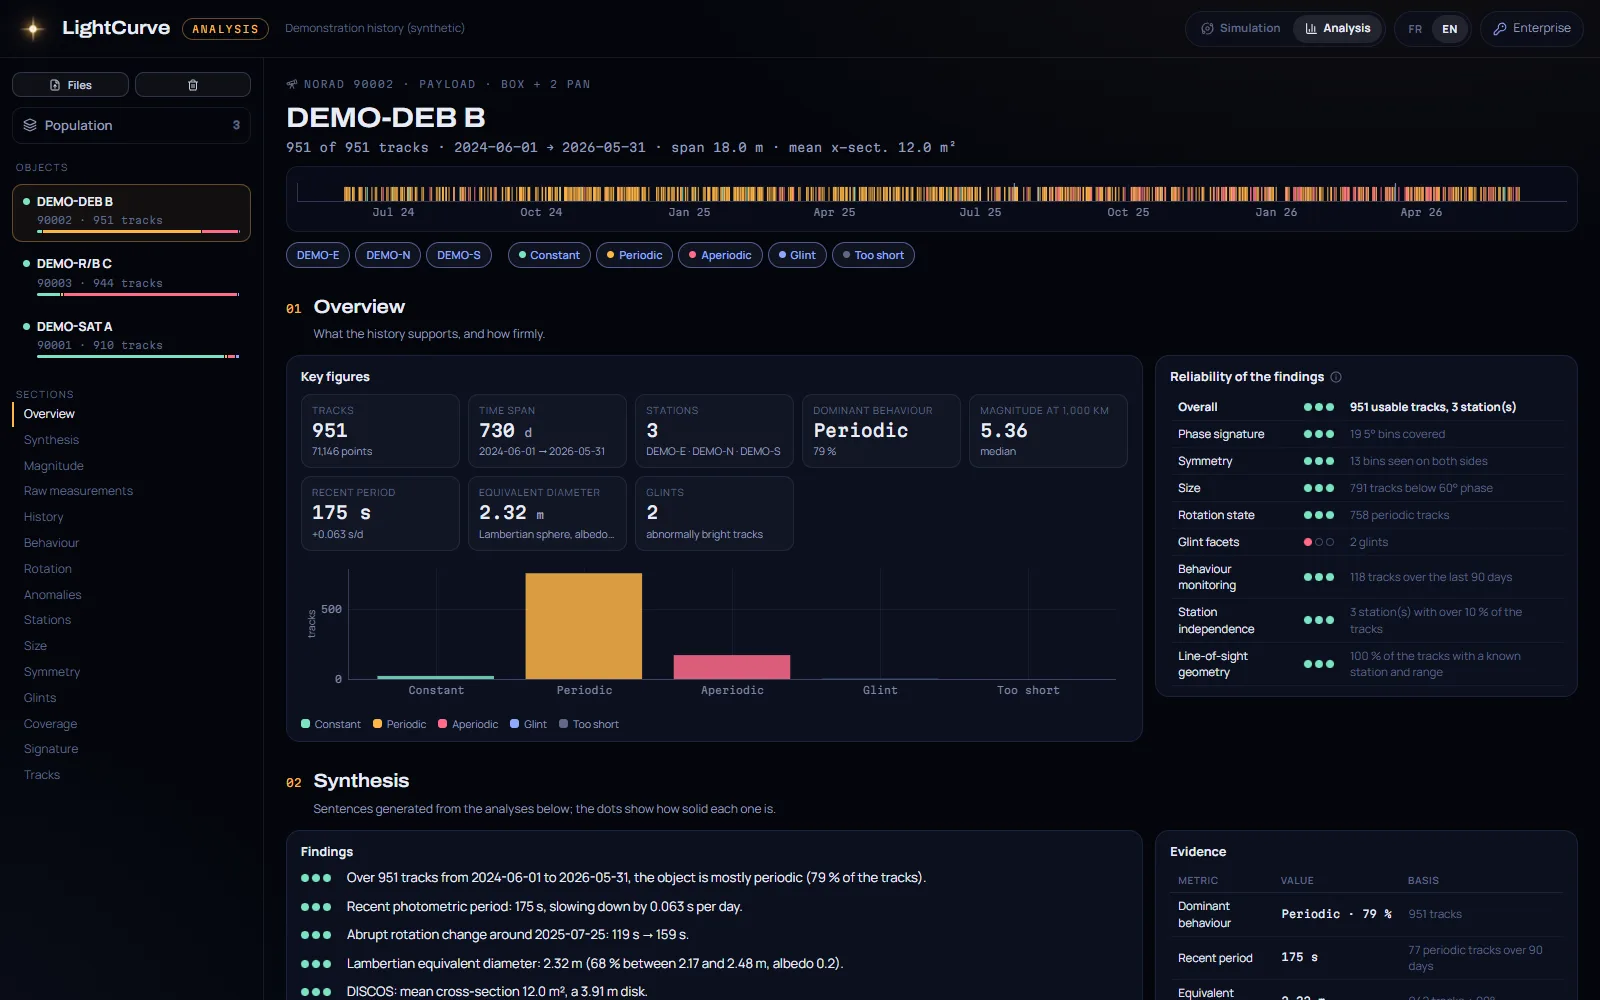
Load the photometric history of a catalogue. Each object gets a report — behaviour, rotation trend, glints, coverage, size — and you get an alert the day one of them stops behaving like itself.
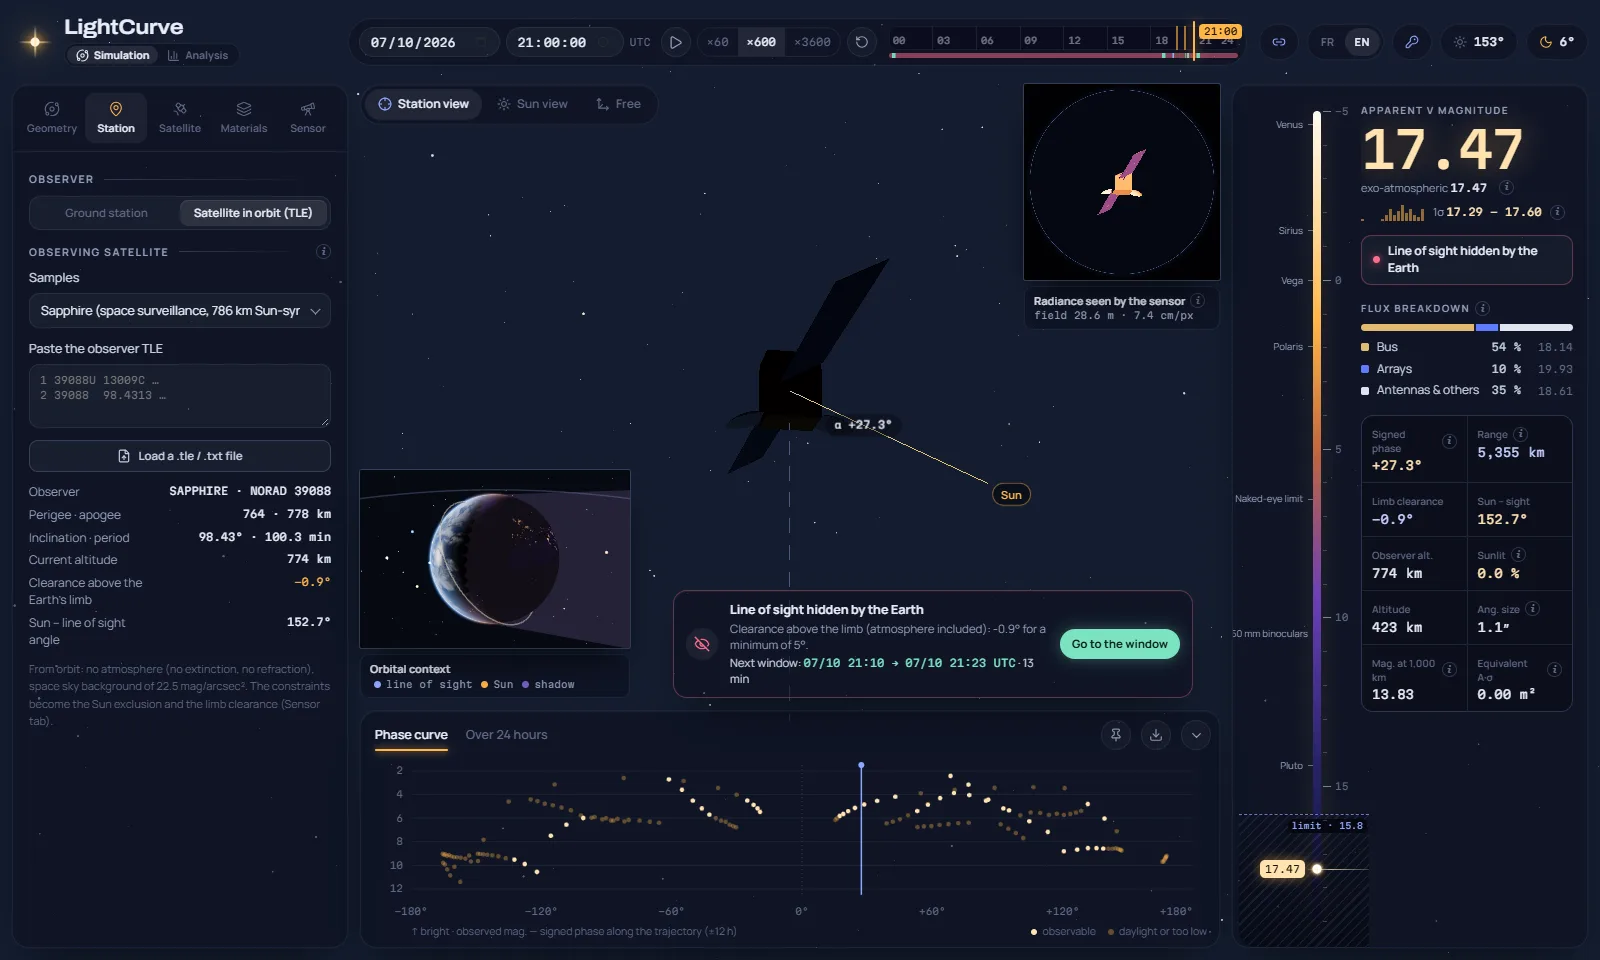
Every way of saying where the object is, from a single angle to a real orbit or a measured track.
From a reference model to your own CAD, with surfaces that behave like the real ones.
Controlled, spinning or tumbling: the motion that writes the light curve.
The object is rendered from the observer, and every pixel carries reflected sunlight.
From the magnitude above the atmosphere to what a given camera will record — on a mountain or on a satellite.
The whole behaviour of an object, not a single number.
Real observations, read back and explained.
The same engine, without the interface, inside your own chain.
Online, nothing to install — or on your premises, offline.
LightCurve is built to be audited. The engine is tested against analytic results, the models against published magnitudes, and every assumption is written down.
Space surveillance is a matter of trust. LightCurve is a European tool for European operators, agencies and armed forces: built on ESA’s DISCOS and the CCSDS standards, hosted in the EU, and designed so that your observations never leave your hands.
A European publisher, with support in English and French, in your time zone.
The service and its accounts run in data centres in the EU, operated by a European provider.
Measurements, orbits, CAD models and histories are processed in your browser. None of them is ever uploaded.
GDPR by design. For classified or air-gapped work, LightCurve runs entirely on your premises, with no connection to us.
Nothing else is stored: no measurement, no model, no result.
Nothing comes in, nothing goes out
Evaluating the capabilities before buying
Free 7-day trial, on request
02Your objects come in, your results go out
Engineers, sensor and mission designers
€12,000 / year Up to 10 users · excl. VAT
03Your measurements come in
Space surveillance operators and analysts
€24,000 / year Up to 10 users · excl. VAT
Compare the plans → Public university or laboratory? See the Academic offer.
We extend LightCurve for our customers: additional developments are made on request to fit your mission, your sensors and your workflow.
Discuss a developmentModels of your spacecraft or targets from your CAD and specifications, with their materials and attitude laws.
Readers and writers for your measurement, orbit and attitude formats, and connectors to your databases.
New algorithms, indicators, reports and alerts, built around the questions you need answered.
Integration with your systems through the API and batch mode, on our hosting or on your premises.
The apparent V magnitude of a satellite, a space station or a rocket body seen from a ground site or from another satellite, for a date, a geometry, a 3D model, its materials and its attitude. From it: the signal-to-noise ratio for a given sensor, and phase, 24-hour and rotation light curves.
The engine reproduces the analytic Lambertian sphere within 0.002 mag up to 120° of phase, and a validation set reproduces published magnitude definitions. For a real satellite, accuracy is set by how well the model and its materials describe it — which is why LightCurve fits them to your measurements and gives a Monte-Carlo uncertainty.
Online by default: LightCurve is a hosted web application, nothing to install. For specific needs — classified data, air-gapped networks — LightCurve also deploys on your own premises, as an add-on to any plan, and runs fully offline.
Nowhere: the computation runs in your browser, so your measurements, orbits, models and histories are read and processed locally, never uploaded. Our servers, in the European Union, only hold the accounts and their licences.
Yes. LightCurve is designed, developed and supported in Europe, and the service is hosted in the European Union by a European provider. It builds on European and international standards — ESA’s DISCOS catalogue, CCSDS messages — and, for sovereign needs, it runs entirely on your premises.
Measurements as CSV or CCSDS TDM, stations as CSV, orbits as TLE or CCSDS OEM, attitude as CCSDS AEM, models as glTF / GLB, OBJ or STL, BRDF tables as CSV, and DISCOS metadata exports.
Yes: a batch mode evaluates thousands of configurations from the command line, a JavaScript API drives the engine, and a dataset generator produces labelled light curves.
A recent Chrome, Edge, Firefox or Safari with hardware acceleration (WebGL 2), an internet connection and your account — nothing to install. On-premises deployments run without any connection.
Yes. On top of the plans, we make additional developments on request: models of your spacecraft, readers for your data formats, new analyses and alerts, integration with your systems.
In four plans — Trial, Academic, Simulations and Operations — as a subscription to the hosted service: each user signs in with their own account, and the plan of their organisation decides which modules they get. On-premises deployments use signed licence keys checked locally. Tell us about your use case and we will propose the right plan.
A 30-minute session on your use case: your orbits, your sensors, your measurements if you have them.