Make satellite photometry visible
See why a satellite brightens or fades — phase angle, glint, shadow, attitude — live and in 3D, with physics you can check.
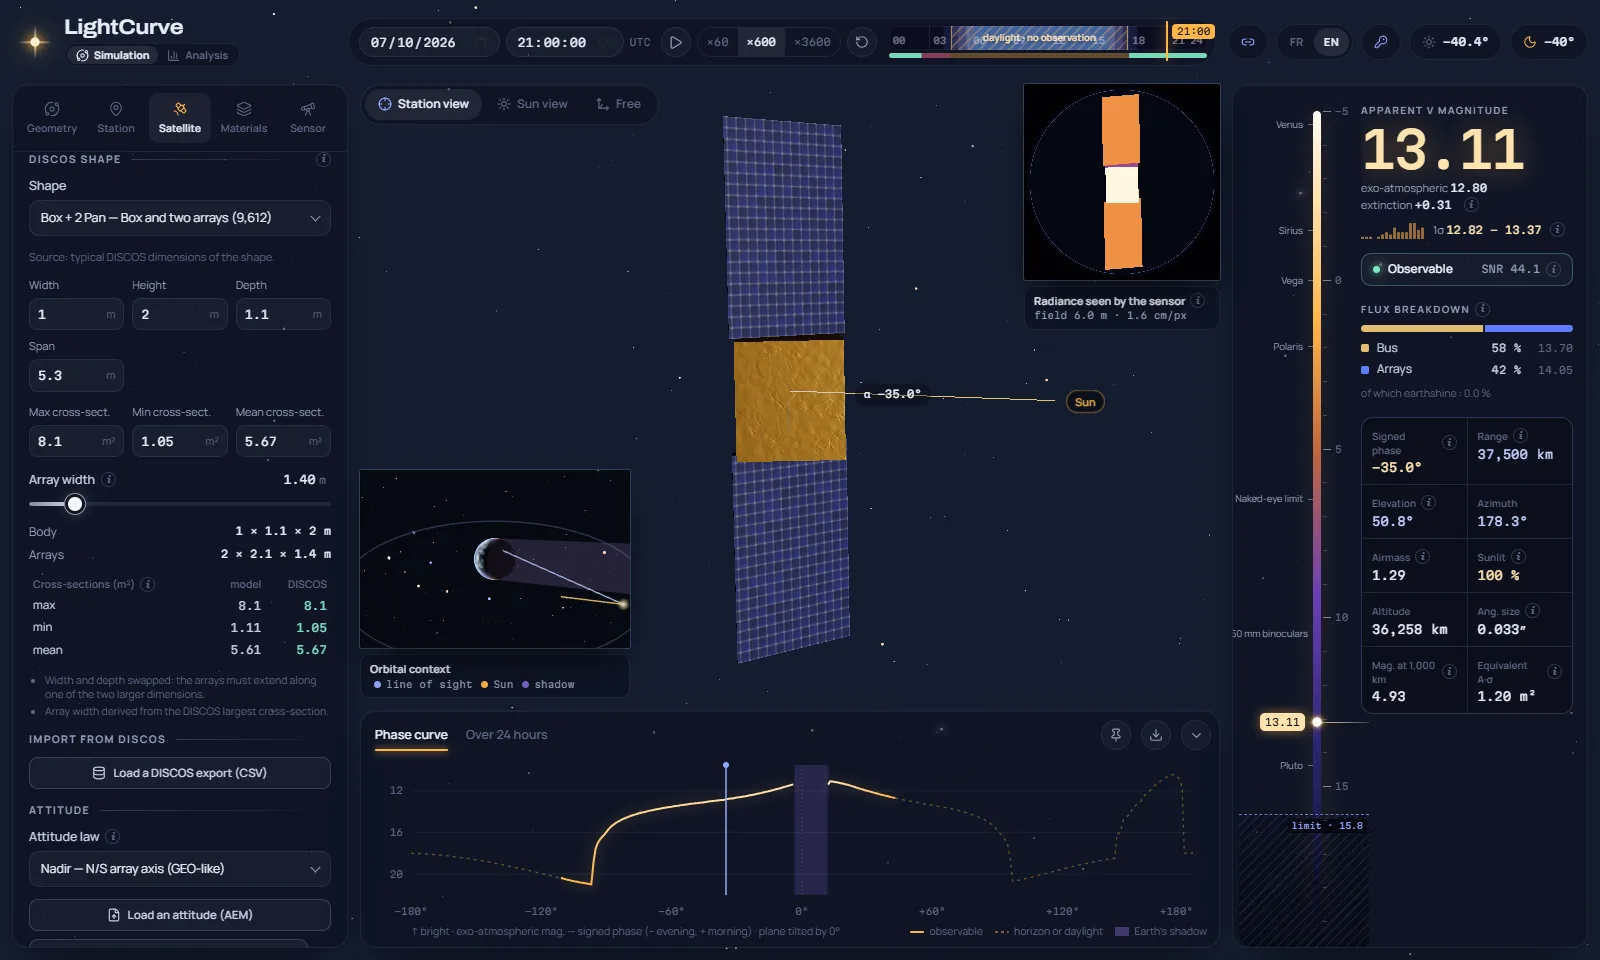
Light curves are hard to teach from equations alone, and research codes are hard to share. Both need something you can open, play with and trust.
Step by step.
- 01
Show it
The Sun, the station and the object in 3D, the image seen by the sensor, the magnitude on a scale from Venus to Pluto. Every parameter explains itself.
- 02
Trust it
A Lambertian sphere matches the analytic formula within 0.002 mag up to 120° of phase; a validation set reproduces published magnitudes; 153 automated tests.
- 03
Share it
It opens in any modern browser, nothing to install for students or colleagues. A link carries the whole configuration.
Deliverables.
- Interactive classroom demonstrations
- Configurations shared by link
- Curves exported as CSV
Check a constellation against the night sky
The magnitude of every design option along real passes, with its uncertainty — to build satellites that astronomers can live with.
See the use caseSize a sensor network before you buy it
SNR, limiting magnitude and saturation of real telescope and camera combinations, against the objects you must see — from the ground or from orbit.
See the use caseTrain classifiers on labelled light curves
Physically rendered, perfectly labelled synthetic light curves — shape, attitude state, period, axis, geometry, sensor noise — by the thousand.
See the use caseSee your own objects in LightCurve.
A 30-minute session on your use case: your orbits, your sensors, your measurements if you have them.