Years of tracks, read at a glance.
The Analysis workspace reads the photometric history of a whole catalogue — many objects, many stations — and turns it into a report per object and a view of the population. It tells you what each object usually does, and when it stops doing it.
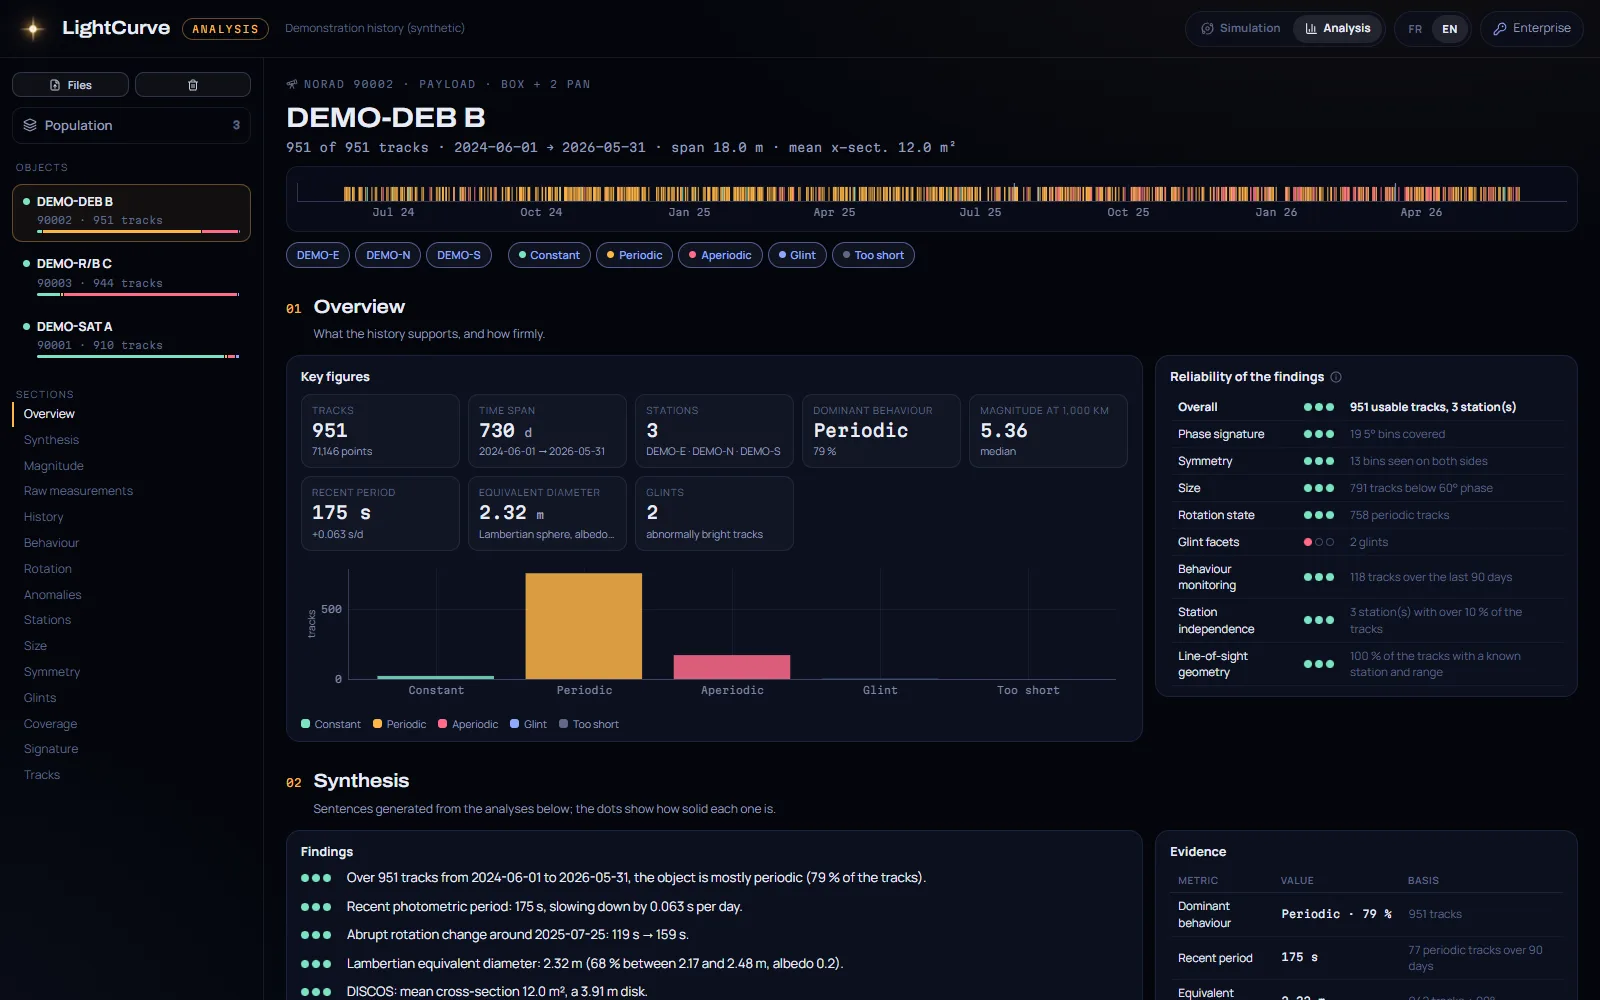
Fifteen sections per object, all linked.
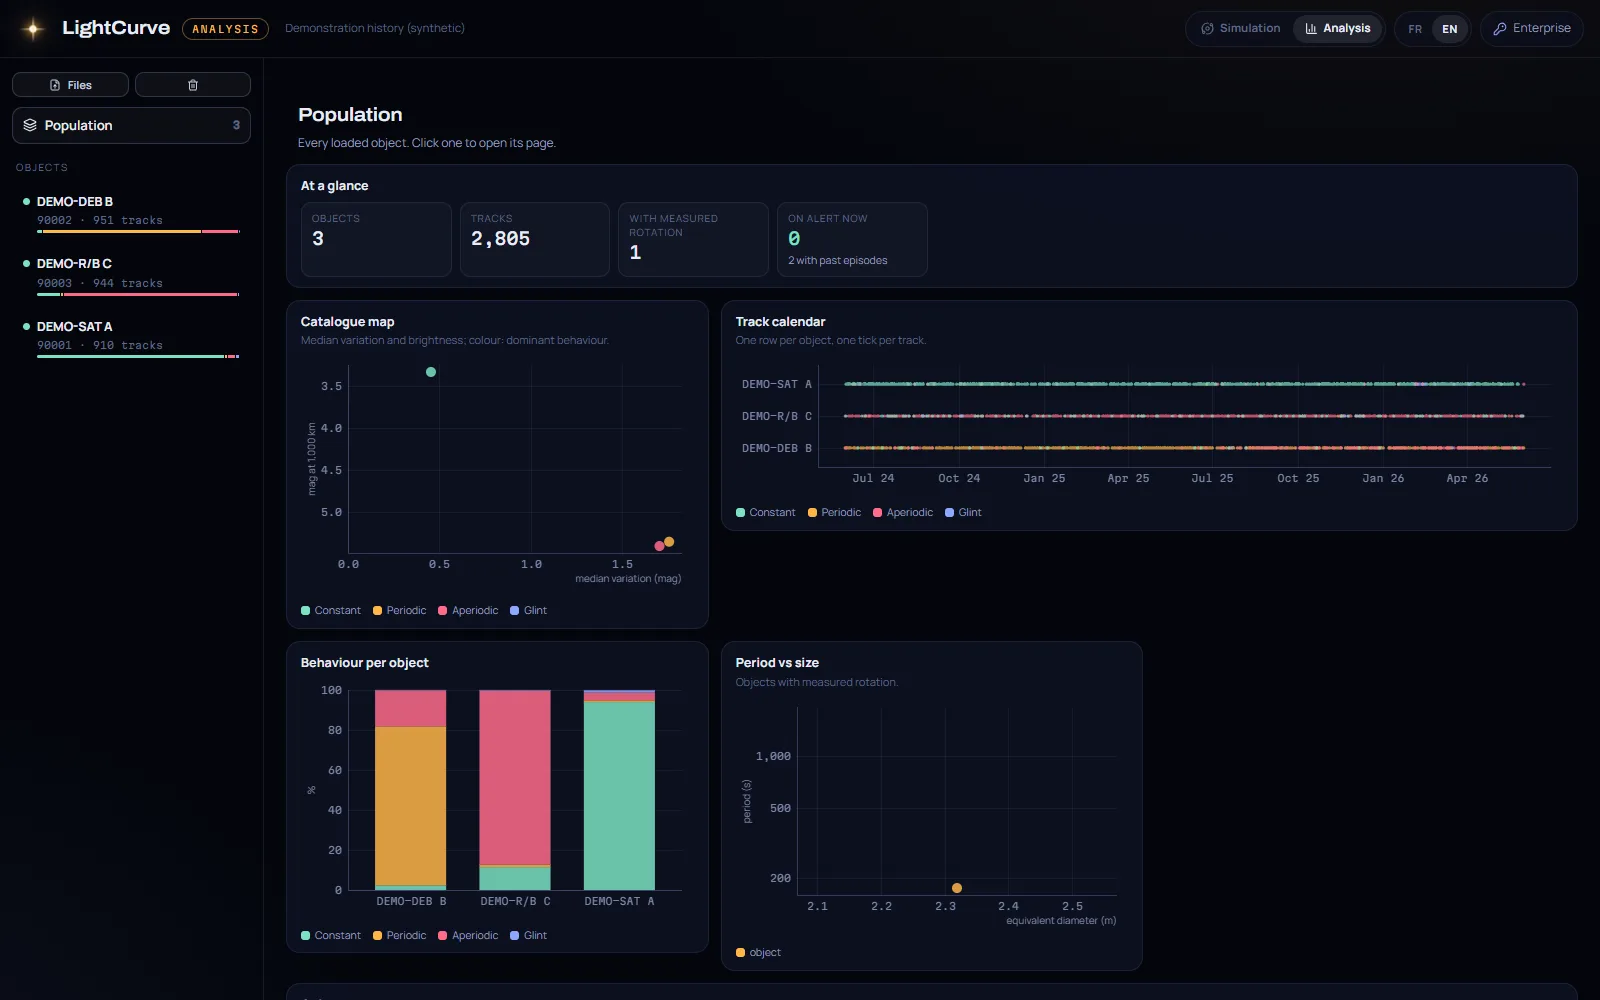
Filter by station, by behaviour or by period on the track calendar: every chart follows. Hover a point to see its track, click to open it.
- 01
Overview and reliability
Key figures and how much data supports each finding.
- 02
Written synthesis
Plain sentences with a confidence level, and the evidence behind them.
- 03
Magnitude evolution
Against phase and time, standardized, by season.
- 04
Raw measurements
Hundreds of thousands of points, coloured by date.
- 05
Weekly history
Variation, periodicity and brightness week by week.
- 06
Behaviour classes
Constant, periodic, aperiodic, glint — and how the mix changes.
- 07
Rotation
Period over time, weighted trend, drift and abrupt changes.
- 08
Anomaly detection
A sliding window against the object’s own history.
- 09
Stations
Coverage and agreement between stations and sites.
- 10
Size
Lambertian equivalent diameter, against DISCOS.
- 11
Evening / morning symmetry
Both sides of the phase curve, compared.
- 12
Specular glints
When, where and which facet: equinoxes, Sun declination, clusters.
- 13
Angular coverage
Where the object was seen from, in its own frame.
- 14
Signature
Eight indicators, nearest neighbours and predicted class.
- 15
Tracks
Every pass, sortable; each one opens in detail.
Alerts that know each object.
There is no universal threshold for “abnormal”. The monitor compares the latest tracks of an object with its own recent history, on brightness and on periodicity, and raises a watch or a confirmed alert — shaded on the calendar and flagged in the object list.
- Robust statistics, insensitive to outliers
- Episodes grouped with their dates and peak scores
- Abrupt rotation changes detected on the spin trend
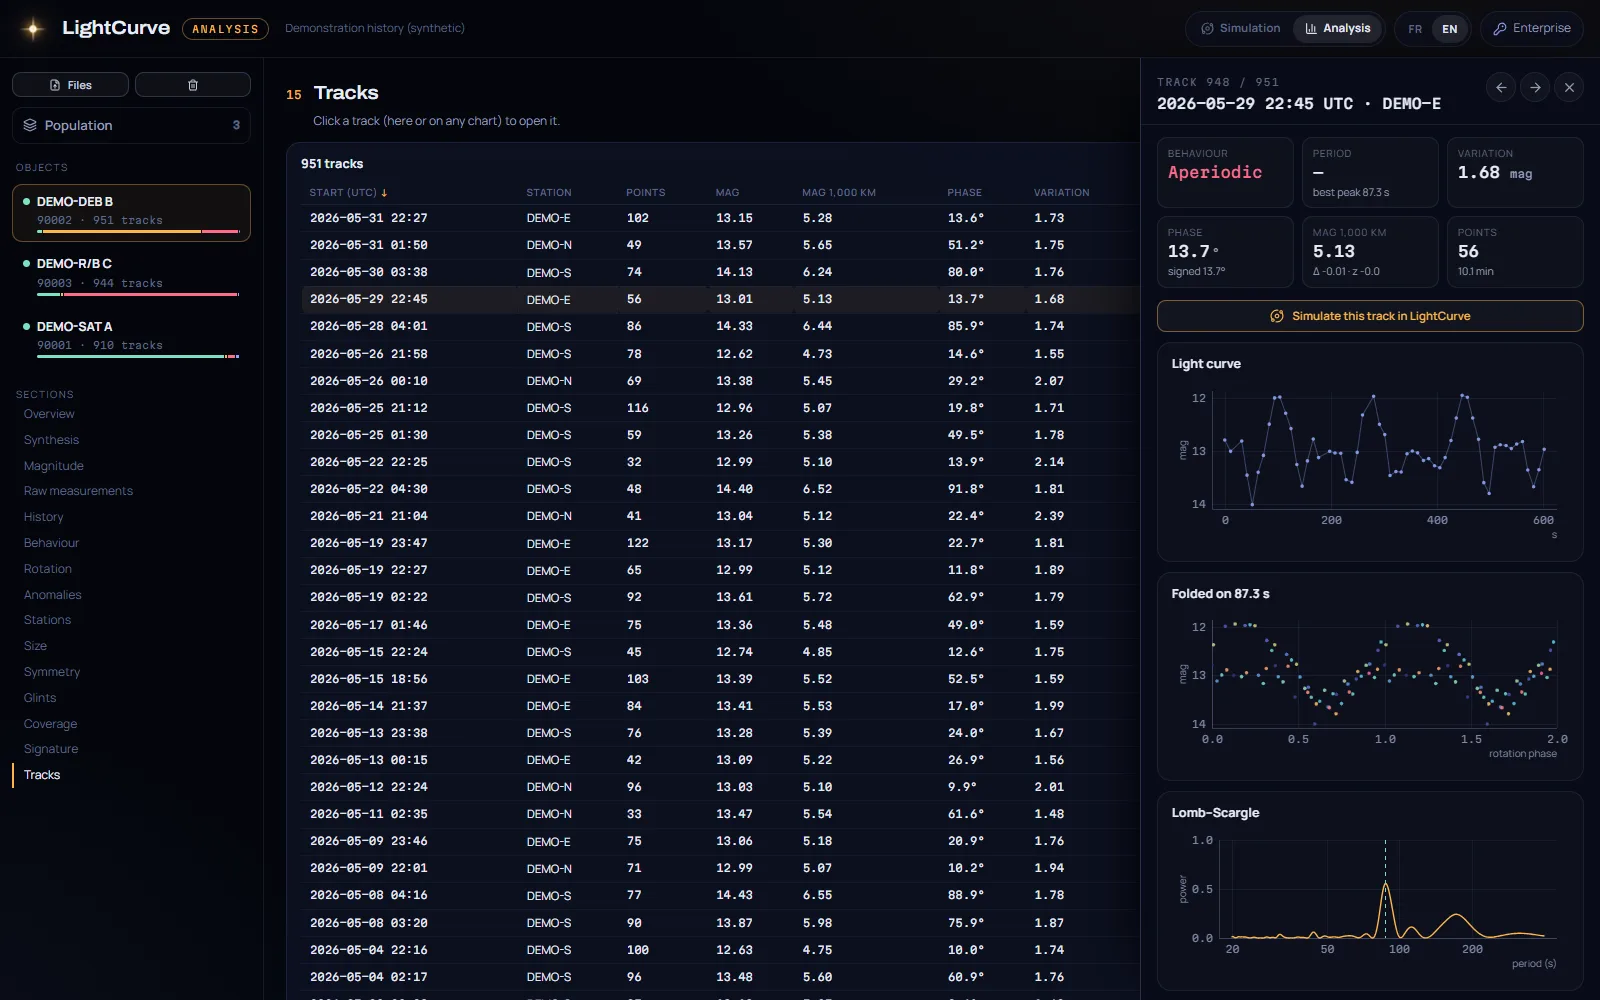
Open any track in the simulator.
Each pass opens with its light curve, its folded curve, the periodogram, phase dispersion and autocorrelation. One click loads it into the simulator with its measured line of sight, station and date — to test a model against it.
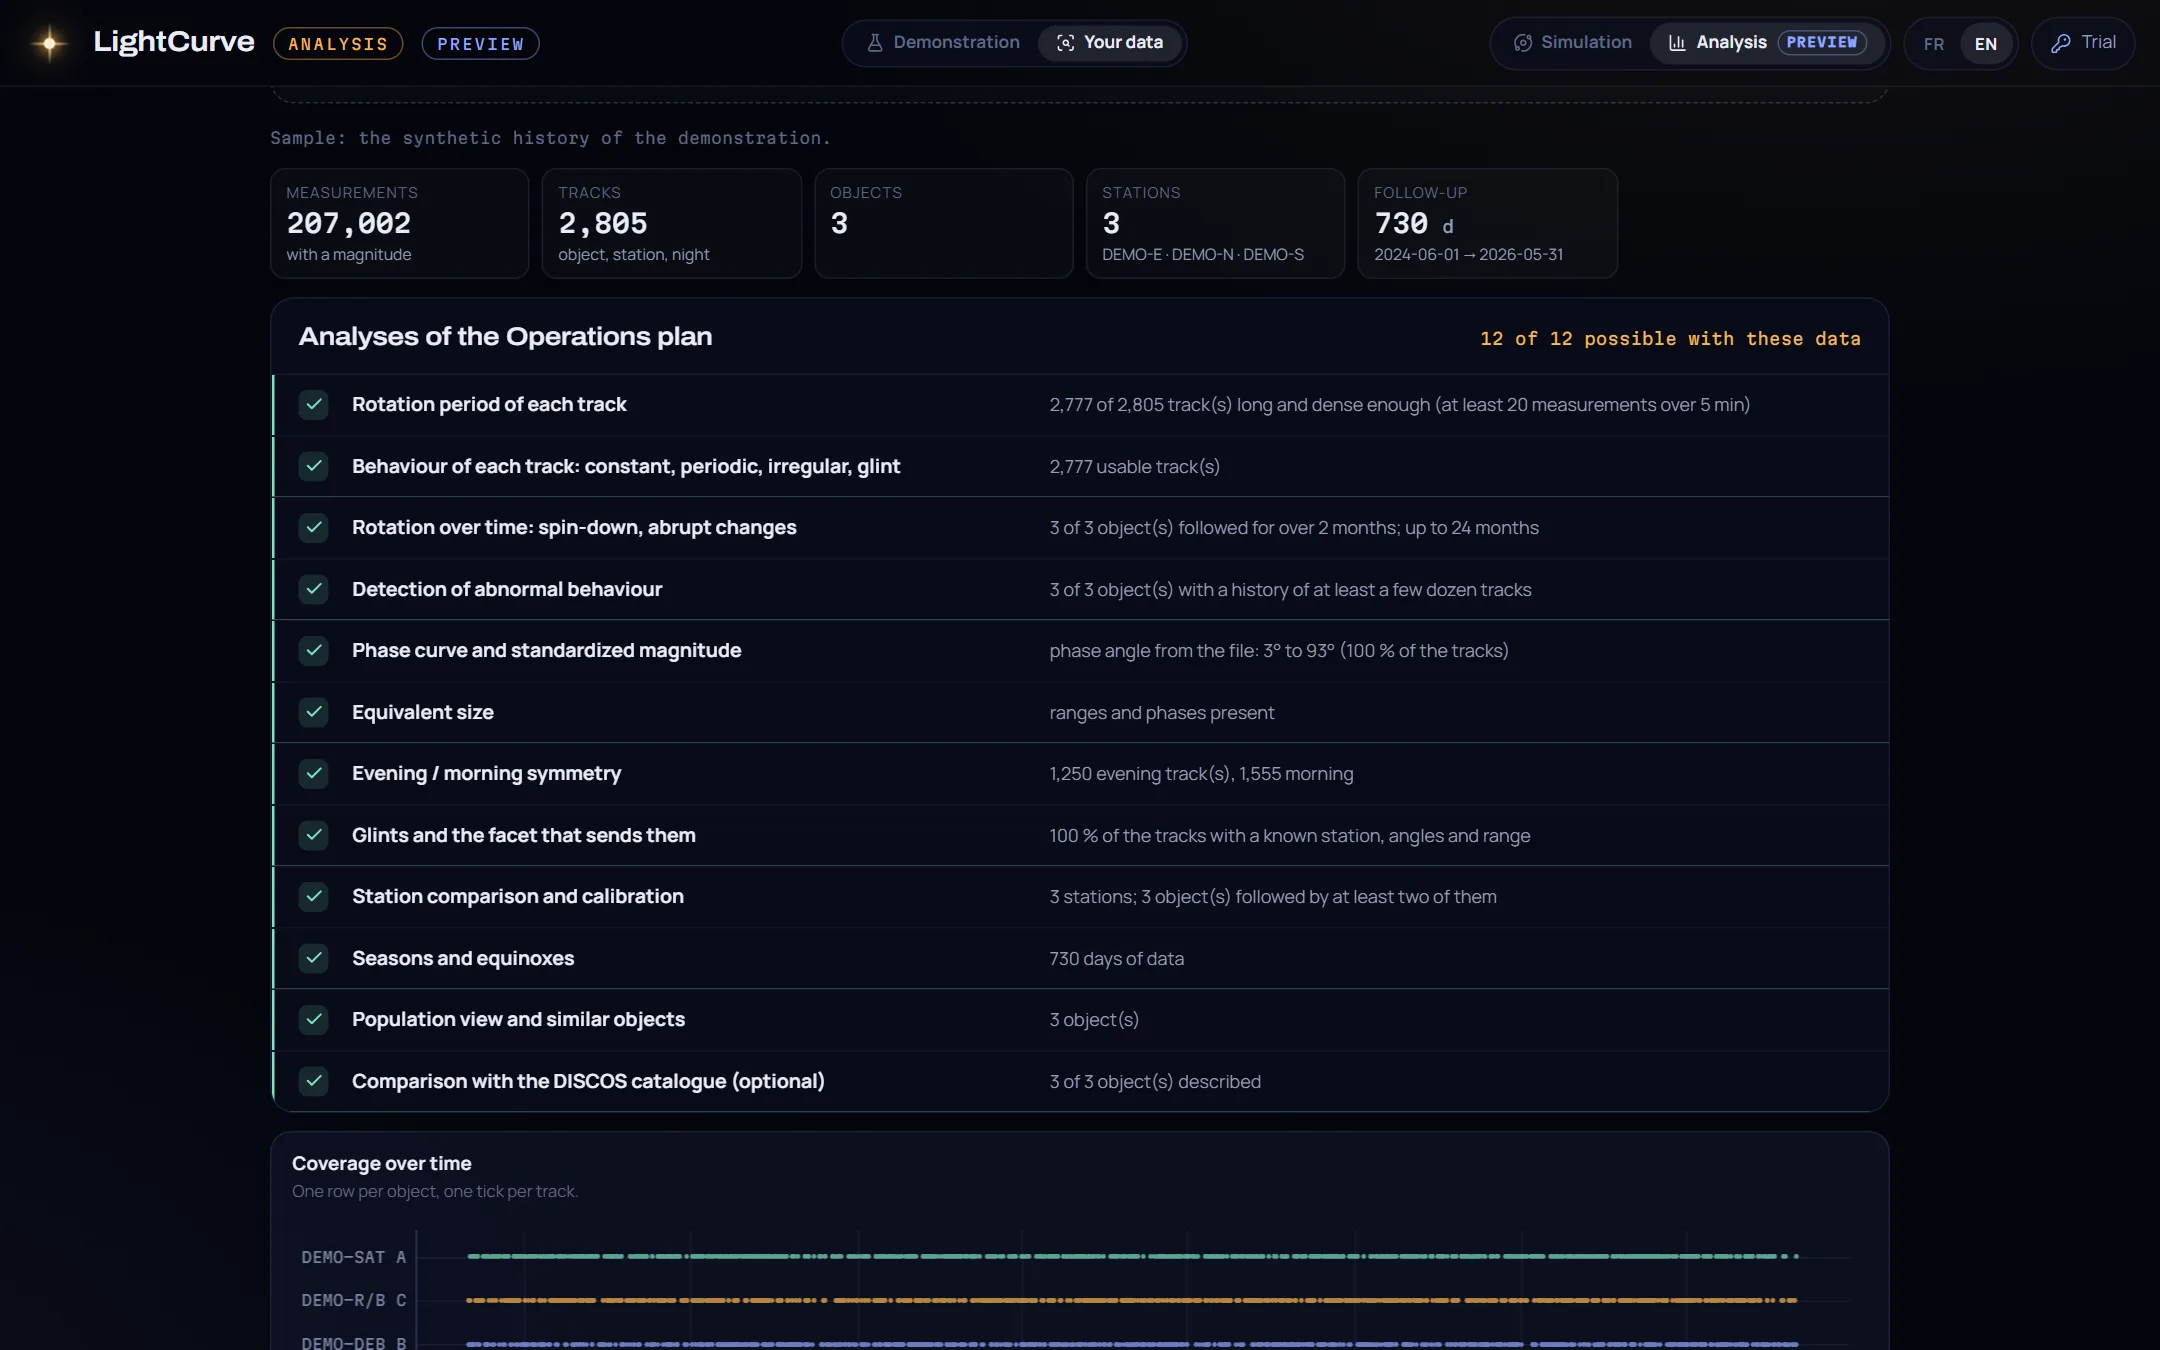
See what your own data would give.
The free Trial opens a preview of the Analysis workspace. Drop your measurement files: LightCurve takes stock of them — tracks, follow-up time, stations, phase coverage, geometry — and tells you, analysis by analysis, what they allow and what would help. Your files are read in your browser and never sent.
- Measurement CSV or CCSDS TDM, with stations and DISCOS if you have them
- The full report, read-only, on a two-year synthetic history
- An evaluation on your real data, on request
Processed in your browser
Files are read by a background worker in the browser, not uploaded. On premises, the whole module runs offline.
Built for volume
Tens of thousands of tracks and millions of points, drawn on canvas and analysed in seconds.
Plain files in
Measurement CSVs or CCSDS TDM, a stations file with types and sites, and an optional DISCOS export.
Bring a month of your tracks.
We will run the Analysis workspace on it with you and walk through what it finds.