Characterise objects from their light curves
Turn magnitudes into answers: is it stabilised, spinning or tumbling, how fast, how big — and does a physical model explain what your sensors measured?
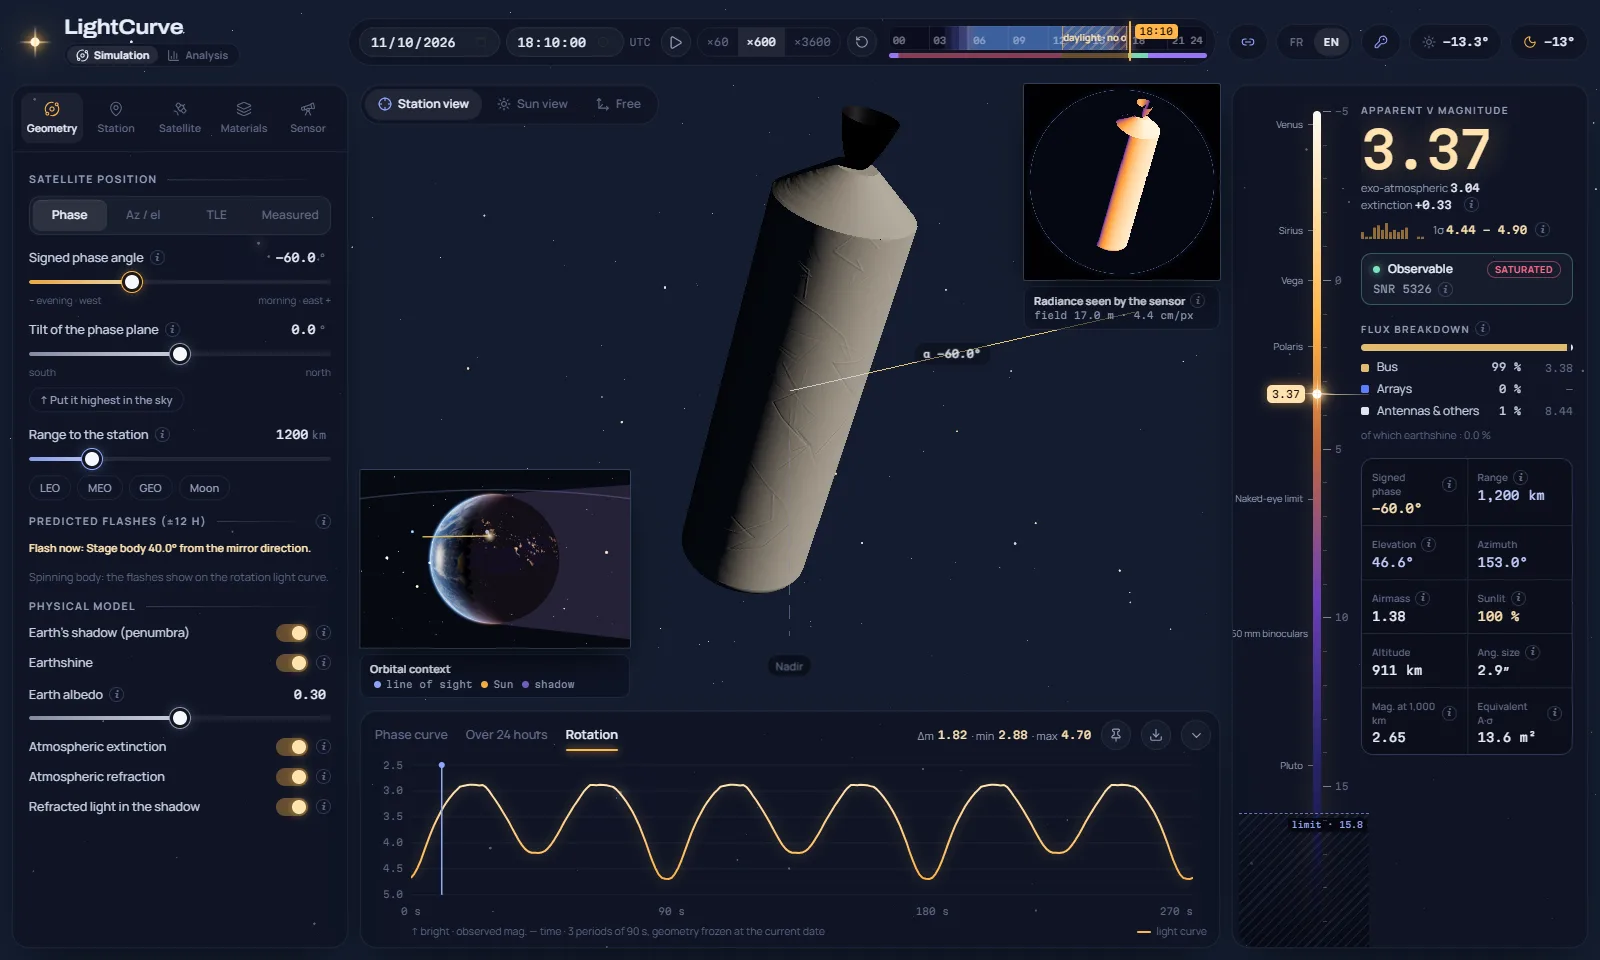
A sensor network produces magnitudes, not answers. Whether an object is controlled, how fast it spins and what its surfaces are made of is written in its light curve — provided you can separate what the geometry does from what the attitude does.
Step by step.
- 01
Load the tracks
CSV or CCSDS TDM files from one or many stations. When a file only names its station, its position is recovered from the measured angles.
- 02
Read the rotation
Lomb–Scargle periodogram built for irregular sampling, the ×2 alias of double-peaked curves, and the curve folded on the chosen period.
- 03
Classify the attitude state
Stabilised, stabilised with glints, regular rotation or tumbling — with a confidence index, side by side with the classification of the simulation.
- 04
Explain it with a model
Start from a catalogue model, a DISCOS shape or your CAD, then fit albedos, attitude, array angle and spin to several nights and stations at once.
Deliverables.
- Spin period and attitude state, with their confidence
- Fitted model parameters and residuals per series
- Simulated against measured magnitudes, with the phase-angle check
- Simulated observations exported as CCSDS TDM
Watch a whole catalogue for behaviour changes
Months of tracks from many stations, turned into a report per object — behaviour, rotation trend, glints — and alerts the day something changes.
See the use caseKnow the tumble before the rendezvous
Estimate a target’s spin period, its axis and how they evolve, from ground photometry — to plan the approach and the capture of a non-cooperative object.
See the use caseTrain classifiers on labelled light curves
Physically rendered, perfectly labelled synthetic light curves — shape, attitude state, period, axis, geometry, sensor noise — by the thousand.
See the use caseSee your own objects in LightCurve.
A 30-minute session on your use case: your orbits, your sensors, your measurements if you have them.