Watch a whole catalogue for behaviour changes
Months of tracks from many stations, turned into a report per object — behaviour, rotation trend, glints — and alerts the day something changes.
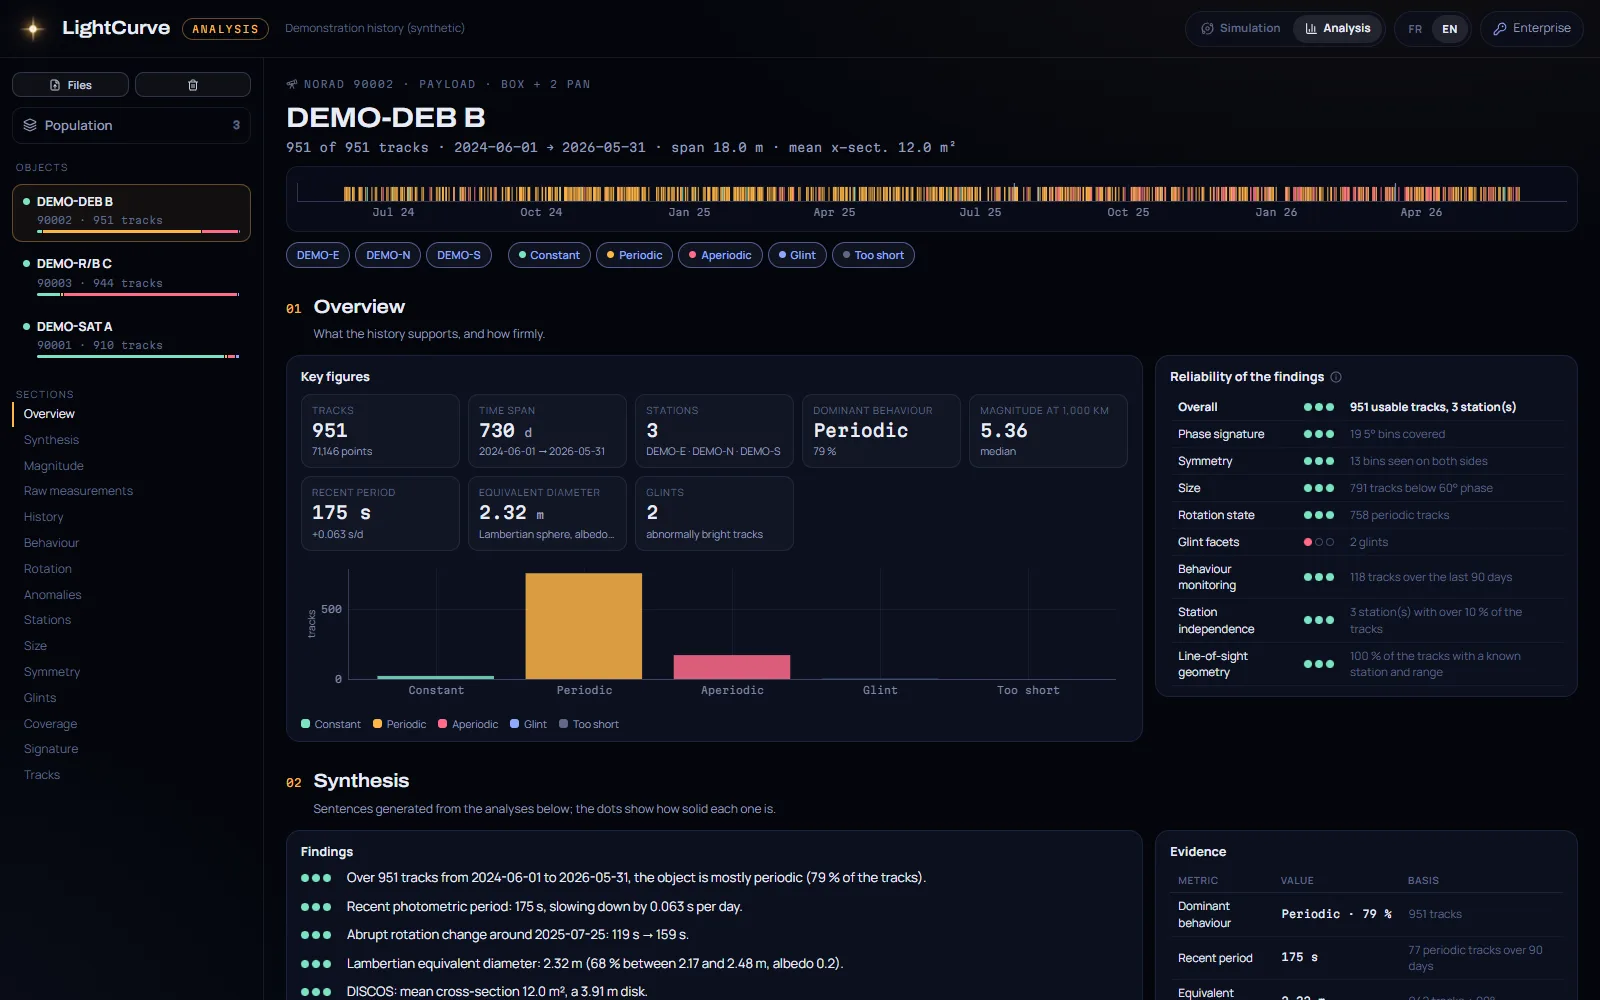
Thousands of tracks a month is more than anyone can read. What matters is the object whose light curve stopped looking like itself.
Step by step.
- 01
Load the history
One or many objects, many stations, a stations file and a DISCOS export, processed in your browser.
- 02
Read each object
Magnitude against phase and time, behaviour classes, rotation and its abrupt changes, glints and the facets behind them, angular coverage, equivalent size.
- 03
Get alerted
The latest tracks are compared with each object’s own history; watch and confirmed levels on brightness and periodicity.
- 04
Go from report to physics
Compare the population, find look-alike objects, and open any track in the simulator with its measured geometry.
Deliverables.
- A 15-section report per object
- Population view across the catalogue
- Alert episodes with their dates and scores
- Signature comparison and nearest neighbours
Characterise objects from their light curves
Turn magnitudes into answers: is it stabilised, spinning or tumbling, how fast, how big — and does a physical model explain what your sensors measured?
See the use caseKnow the tumble before the rendezvous
Estimate a target’s spin period, its axis and how they evolve, from ground photometry — to plan the approach and the capture of a non-cooperative object.
See the use casePredict, then explain, the brightness of your satellite
From design review to anomaly investigation: how bright your spacecraft looks, where its glints come from, and what a change in its light curve means.
See the use caseSee your own objects in LightCurve.
A 30-minute session on your use case: your orbits, your sensors, your measurements if you have them.